Another look at DLNM with inlabru

Methods
DLNM
inlabru
Author

Olivier Supplisson

Published

April 28, 2026

This methods note will take another look at distributed lag non-linear models with inlabru. More specifically, I’ll show how to specify the model using the _eval features.

Simulated data

The simulated example mimics daily counts driven by a temperature-like exposure. The exposure has a seasonal cycle and autocorrelated weather noise. The outcome depends on the previous seven daily exposures, with a sharper short-lag heat effect and a weaker, more persistent cold effect. The baseline is constant so that the fitted model and the data-generating model have the same additive structure.

set.seed(20260428)

library(ggplot2)

n_days <- 5L * 365L
max_lag <- 7L

dates_full <- seq.Date(
  from = as.Date("2021-01-01"),
  by = "day",
  length.out = n_days + max_lag
)

day_of_year <- as.integer(format(dates_full, "%j"))
annual_phase <- 2 * pi * (day_of_year - 1) / 365.25

weather_noise <- as.numeric(arima.sim(
  model = list(ar = 0.85),
  n = length(dates_full),
  sd = 2.8
))

temperature <- 16 +
  9 * sin(annual_phase - pi / 2) +
  weather_noise

make_lagged_history <- function(x, max_lag) {
  idx <- seq_len(length(x) - max_lag) + max_lag

  out <- vapply(
    0:max_lag,
    function(lag) x[idx - lag],
    numeric(length(idx))
  )

  colnames(out) <- paste0("temp_lag_", 0:max_lag)
  out
}

temperature_history <- make_lagged_history(temperature, max_lag)
lag_grid <- 1:max_lag

true_lag_effect <- function(temp, lag) {
  heat_effect <- 0.0040 * pmax(temp - 22, 0)^2 * exp(-lag / 4)
  cold_effect <- -0.0018 * pmax(8 - temp, 0)^2 * exp(-lag / 10)

  heat_effect + cold_effect
}

dlnm_effect <- rowSums(vapply(
  seq_along(lag_grid),
  function(j) {
    true_lag_effect(
      temp = temperature_history[, paste0("temp_lag_", lag_grid[j])],
      lag = lag_grid[j]
    )
  },
  numeric(nrow(temperature_history))
))

dates <- dates_full[(max_lag + 1):length(dates_full)]
day_index <- seq_along(dates)

baseline <- rep(log(18), length(day_index))

eta <- baseline + dlnm_effect
expected_count <- exp(eta)
count <- rpois(length(expected_count), lambda = expected_count)

dlnm_data <- data.frame(
  date = dates,
  day = day_index,
  count = count,
  temperature = temperature[(max_lag + 1):length(temperature)],
  expected_count = expected_count,
  eta = eta
)

head(dlnm_data)
        date day count temperature expected_count      eta
1 2021-01-08   1    14   0.8165317      15.715687 2.754659
2 2021-01-09   2    11  -1.1571527      14.636658 2.683529
3 2021-01-10   3    12  -2.0099469      13.021999 2.566640
4 2021-01-11   4    14  -0.4228261      11.410286 2.434515
5 2021-01-12   5     8  -2.4110177      10.633295 2.363990
6 2021-01-13   6     7   0.3006791       9.370323 2.237548

The objects needed for the next sections are now available:

  • dlnm_data, with one row per observed day,
  • temperature_history, with one row per observed day and one column per lag,
  • lag_grid, the lag support from 1 to 7,
  • true_lag_effect(), the simulation surface used to generate the response.
count_range <- range(dlnm_data$count)
temperature_range <- range(dlnm_data$temperature)

temperature_to_count_scale <- function(x) {
  count_range[1] +
    (x - temperature_range[1]) *
    diff(count_range) /
    diff(temperature_range)
}

count_to_temperature_scale <- function(x) {
  temperature_range[1] +
    (x - count_range[1]) *
    diff(temperature_range) /
    diff(count_range)
}

dlnm_data$temperature_on_count_scale <- temperature_to_count_scale(
  dlnm_data$temperature
)

ggplot(dlnm_data, aes(x = date)) +
  geom_col(aes(y = count), fill = "grey78", width = 1) +
  geom_line(
    aes(y = temperature_on_count_scale),
    colour = "#08519c",
    linewidth = 0.45
  ) +
  scale_y_continuous(
    name = "Daily count",
    sec.axis = sec_axis(
      transform = ~count_to_temperature_scale(.),
      name = "Temperature"
    )
  ) +
  labs(
    x = "Date",
    title = "Simulated daily counts and temperature exposure"
  ) +
  theme_minimal()

Model components

The first blog post about DLNM relied on a cross-basis construction and a tensor-product precision matrix. Here, I am going to show how to fit the same kind of model without explicitly defining the spline basis. In practice, the precision matrix is specified through the Kronecker product between marginal precision matrices.

One benefit of using inlabru is that the latent component definition can be separated from the predictor expression through the _eval suffix. Here, the latent component is continuously indexed by temperature and discretely indexed by lag. For the simulation check below, I fit the same lag window and baseline structure that were used to generate the data: lags 1 to 7 and a constant baseline.

library(INLA)
library(inlabru)
library(fmesher)

lags_to_fit <- lag_grid
temperature_lag_names <- paste0("temp_lag_", lags_to_fit)

temperature_for_fit <- temperature_history[, temperature_lag_names, drop = FALSE]

min_temp <- min(temperature_for_fit) - 2
max_temp <- max(temperature_for_fit) + 2

mesh1D <- fm_mesh_1d(
  seq(min_temp, max_temp, by = 1),
  degree = 2,
  boundary = "free"
)

spde_temperature <- inla.spde2.pcmatern(
  mesh1D,
  prior.range = c(1, 0.01),
  prior.sigma = c(1, 0.01)
)

dlnm_extra_constraints <- list(
  A = Matrix::Matrix(
    Matrix::diag(fm_fem(mesh1D)$c0),
    nrow = 1,
    ncol = spde_temperature$n.spde,
    sparse = TRUE
  ),
  e = 0
)

past_temperature <- function(day, lag) {
  lag_name <- paste0("temp_lag_", lag)

  if (!lag_name %in% colnames(temperature_history)) {
    stop(sprintf("Lag %s is not available in temperature_history.", lag), call. = FALSE)
  }

  temperature_history[day, lag_name]
}

dlnm_fit_data <- transform(
  dlnm_data,
  one = 1,
  exposure = 1,
  lag_group = 1L
)

comp <- ~
 0 + Intercept(
    model = "linear",
    prec.linear = 0.1,
    mean.linear = 0
  ) +
  Dlnm(
    model = spde_temperature,
    group = lag_group,
    group_mapper = bm_index(length(lags_to_fit)),
    control.group = list(
      model = "rw2",
      scale.model = TRUE
    ),
    extraconstr = dlnm_extra_constraints
  )


baseline_eval_terms <- c(
  "Intercept_eval(main = one)"
)

dlnm_eval_terms <- paste0(
  "Dlnm_eval(main = past_temperature(.data[[\"day\"]], lag = ",
  lags_to_fit,
  "), group = ",
  seq_along(lags_to_fit),
  ")"
)

linear_predictor_eval <- paste(
  c(baseline_eval_terms, dlnm_eval_terms),
  collapse = " + "
)

observational_formula <- as.formula(paste("count ~", linear_predictor_eval))

observational_model <- bru_obs(
    observational_formula,
    data = dlnm_fit_data,
    family = "poisson",
    E = exposure
  )

fit.bru <- bru(
  comp,
  observational_model,
  options = bru_options(
    bru_verbose = 0,
    verbose = FALSE,
    control.inla = list(
      strategy = "auto",
      int.strategy = "auto",
      optimise.strategy = "smart",
      fast = TRUE
    ),
    num.threads = "1:1:1",
    bru_max_iter = 1,
    safe = TRUE
  )
)

The model deliberately mirrors the simulation setup: the fitted predictor has a constant intercept and the same seven lagged exposure terms that generated the counts. Since the data are simulated, the posterior check can be stronger than a usual posterior predictive check. In addition to checking whether replicated counts cover the observed counts, I can compare the posterior latent intensity directly with the true latent intensity used in the simulation.

set.seed(20260428)

n_posterior_samples <- 500L

fitted_intensity_formula <- as.formula(
  paste("~ exp(", linear_predictor_eval, ")")
)

fitted_intensity_draws <- generate(
  fit.bru,
  newdata = dlnm_fit_data,
  formula = fitted_intensity_formula,
  n.samples = n_posterior_samples,
  seed = 20260428
)

replicated_count_draws <- apply(
  fitted_intensity_draws,
  2L,
  function(lambda) rpois(length(lambda), lambda = lambda)
)

posterior_interval <- function(x) {
  unname(quantile(x, probs = c(0.025, 0.975)))
}

fitted_intensity_interval <- t(apply(
  fitted_intensity_draws,
  1L,
  posterior_interval
))

replicated_count_interval <- t(apply(
  replicated_count_draws,
  1L,
  posterior_interval
))

ppc_df <- data.frame(
  date = dlnm_data$date,
  count = dlnm_data$count,
  true_intensity = dlnm_data$expected_count,
  fitted_intensity_mean = rowMeans(fitted_intensity_draws),
  fitted_intensity_q025 = fitted_intensity_interval[, 1],
  fitted_intensity_q975 = fitted_intensity_interval[, 2],
  replicated_count_q025 = replicated_count_interval[, 1],
  replicated_count_q975 = replicated_count_interval[, 2]
)

The grey band is the posterior replicated-count interval, which includes both latent-intensity uncertainty and Poisson sampling variation. The blue band is narrower because it is the posterior interval for the latent intensity itself. The relevant simulation-truth check is therefore the agreement between the black curve and the blue posterior summary.

ppc_plot <- ggplot(ppc_df, aes(x = date)) +
  geom_ribbon(
    aes(
      ymin = replicated_count_q025,
      ymax = replicated_count_q975,
      fill = "95% replicated-count interval"
    ),
    alpha = 0.35
  ) +
  geom_ribbon(
    aes(
      ymin = fitted_intensity_q025,
      ymax = fitted_intensity_q975,
      fill = "95% latent-intensity interval"
    ),
    alpha = 0.65
  ) +
  geom_point(
    aes(y = count, colour = "Observed count"),
    size = 0.35,
    alpha = 0.35
  ) +
  geom_line(
    aes(y = true_intensity, colour = "True latent intensity"),
    linewidth = 0.55
  ) +
  geom_line(
    aes(y = fitted_intensity_mean, colour = "Posterior mean latent intensity"),
    linewidth = 0.65,
    linetype = "longdash"
  ) +
  scale_colour_manual(
    values = c(
      "Observed count" = "grey30",
      "True latent intensity" = "black",
      "Posterior mean latent intensity" = "#08519c"
    )
  ) +
  scale_fill_manual(
    values = c(
      "95% latent-intensity interval" = "#9ecae1",
      "95% replicated-count interval" = "grey80"
    )
  ) +
  guides(
    fill = guide_legend(order = 2),
    colour = guide_legend(order = 1)
  ) +
  scale_y_sqrt() +
  labs(
    x = "Date",
    y = "Count or latent intensity",
    colour = NULL,
    fill = NULL,
    title = "Posterior check against the true latent intensity",
    subtitle = "Black is simulation truth; blue is the posterior fitted intensity. Square-root y scale."
  ) +
  theme_minimal() +
  theme(
    legend.position = "bottom",
    legend.box = "vertical"
  )

ppc_plotly <- plotly::ggplotly(
  ppc_plot,
  tooltip = c("x", "y", "colour", "fill"),
  height = 680
)

ppc_plotly <- plotly::layout(
  ppc_plotly,
  legend = list(orientation = "h", x = 0, y = -0.2),
  margin = list(b = 110)
)

plotly::config(
  ppc_plotly,
  displaylogo = FALSE,
  modeBarButtonsToRemove = c("select2d", "lasso2d")
)

Overall, the posterior fitted intensity follows the black simulation truth closely, while the observed counts scatter around it as expected under the Poisson observation model. The replicated-count interval is wider than the latent-intensity interval, which is exactly the separation we want: uncertainty about the smooth distributed-lag signal should not be confused with day-to-day count noise.

BONUS: two additional ways of fitting BLNM in plain R-INLA

Below are two additional ways of fitting BLNM in plain R-INLA. For convenience, I am only using an AR(1) grouping model instead of RW2.

suppressPackageStartupMessages({
  library(INLA)
  library(fmesher)
})

set.seed(42)

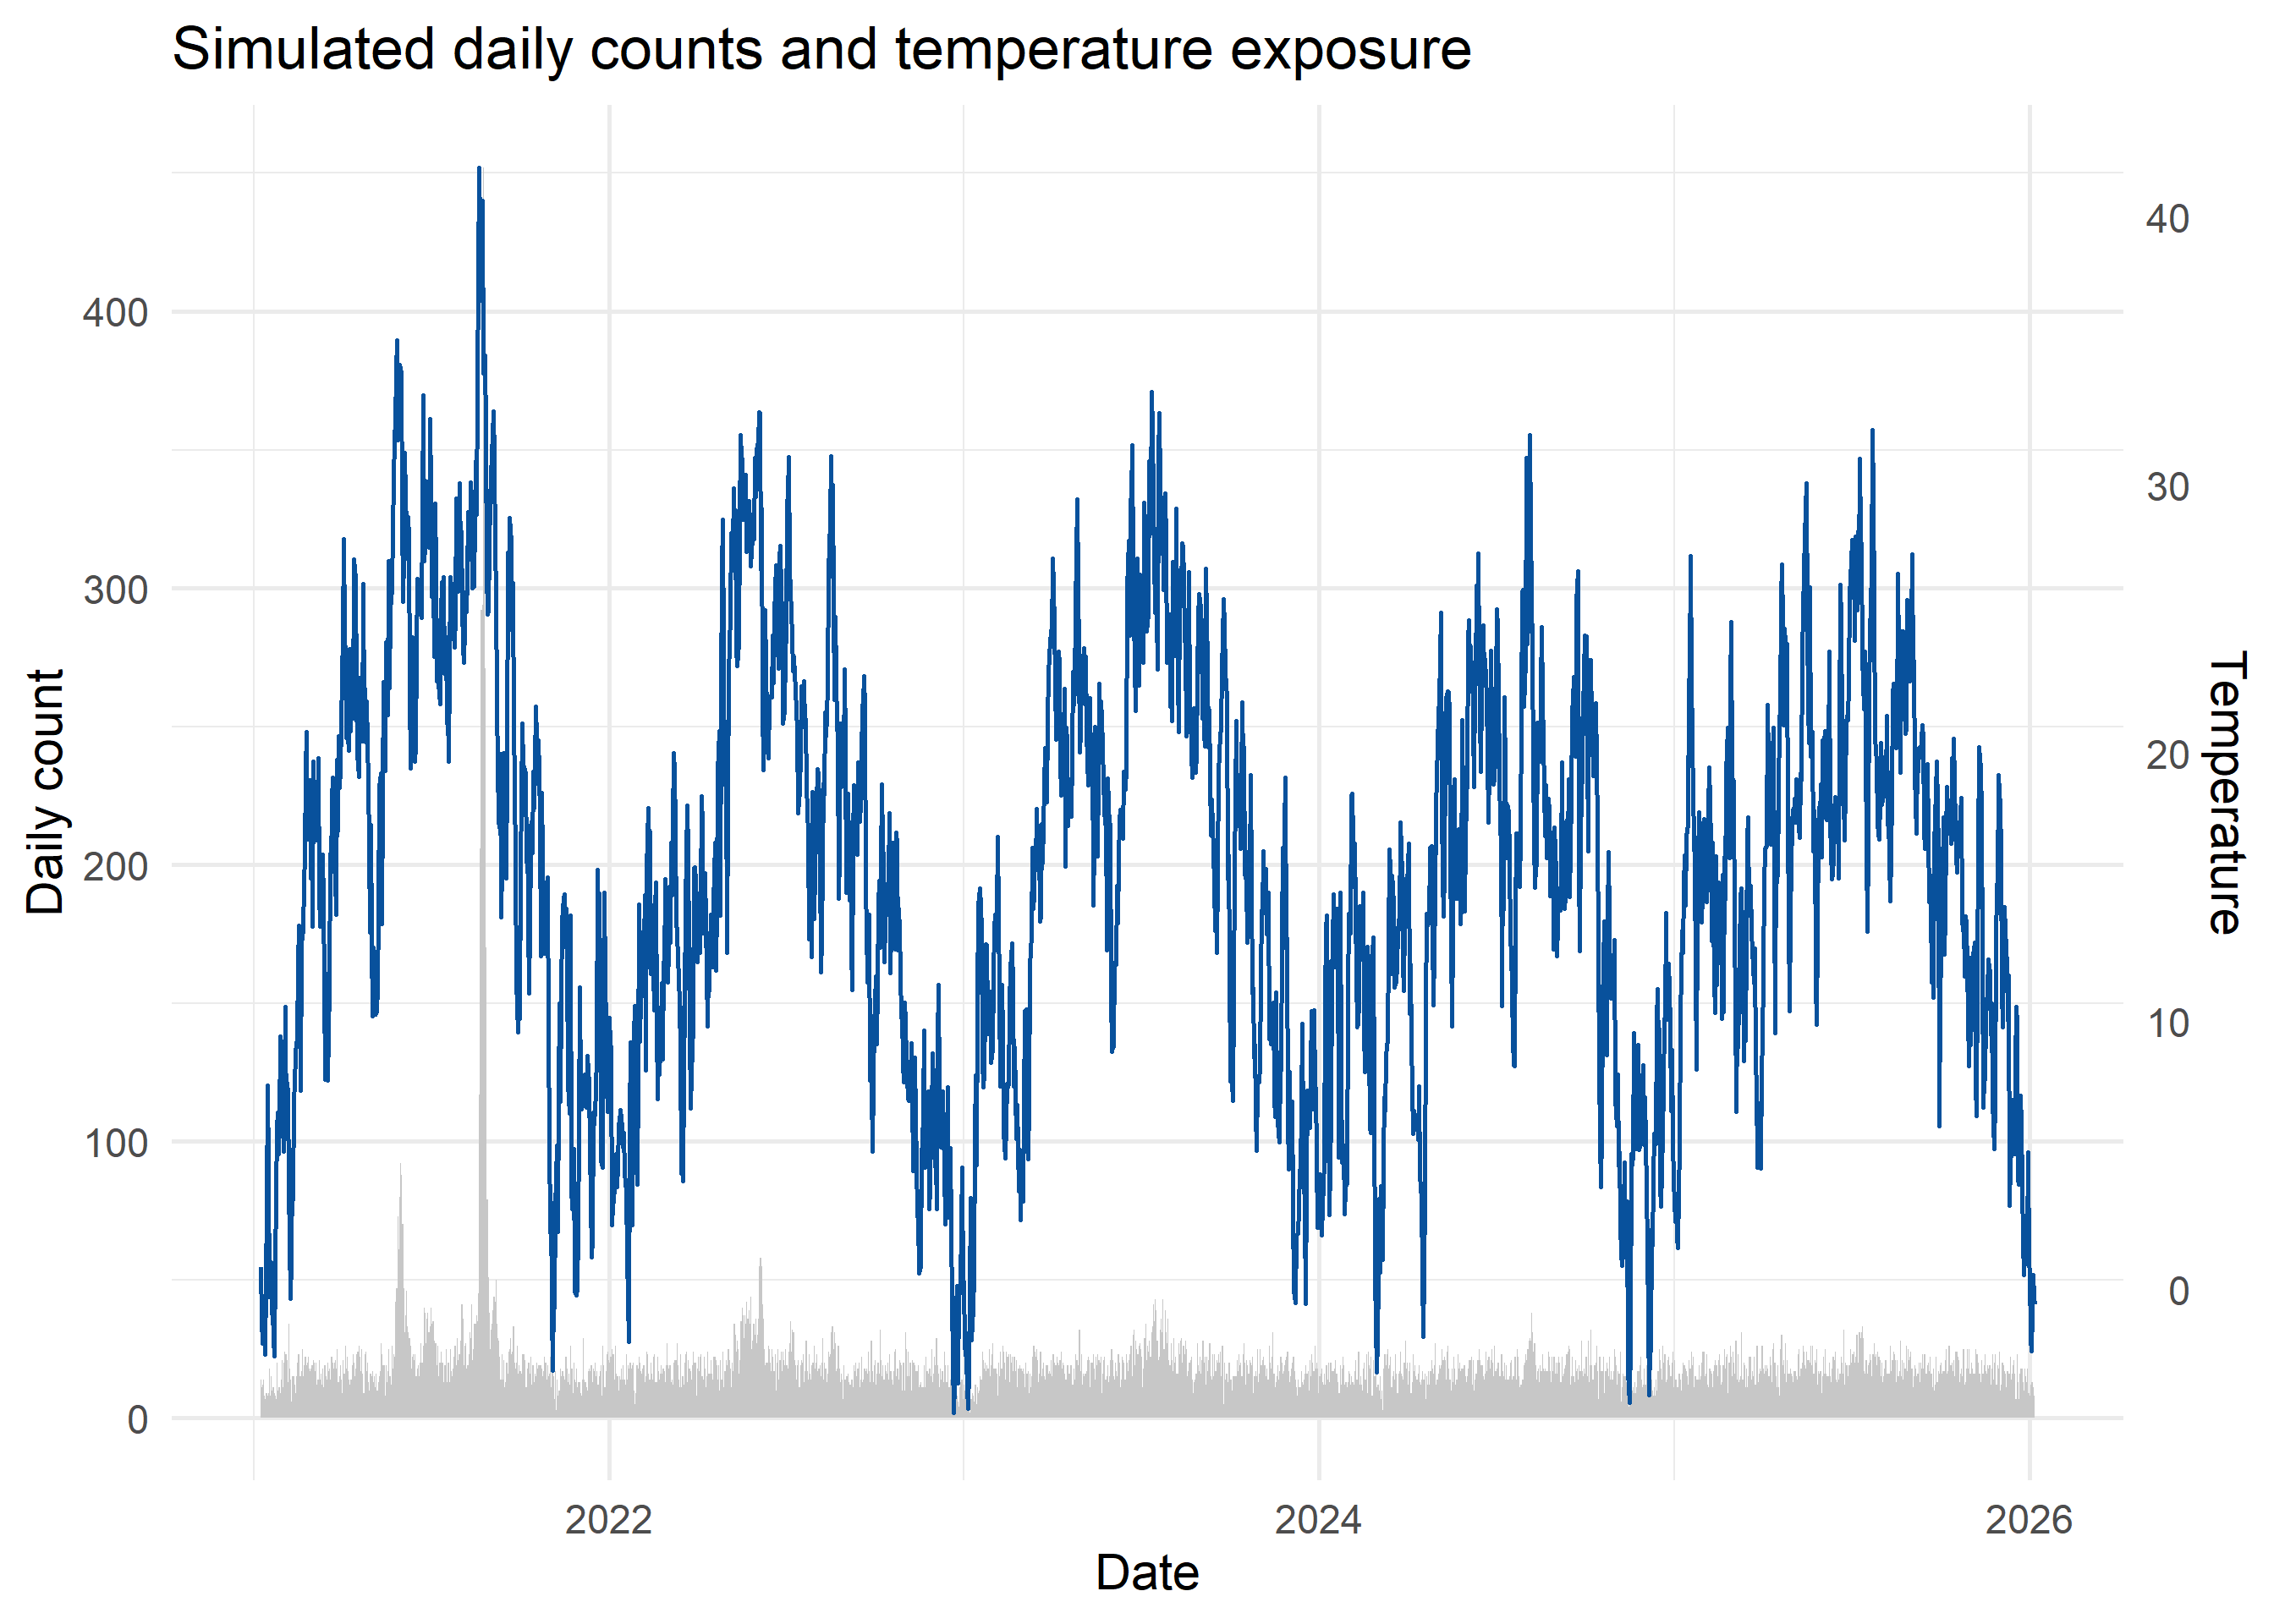
# Simulate a small lagged exposure data set.
n <- 100L
lags <- 1:3
x_full <- as.numeric(arima.sim(list(ar = 0.6), n = n + max(lags), sd = 0.5))
Xlag <- sapply(0:max(lags), \(l) x_full[(max(lags) + 1L - l):(n + max(lags) - l)])
colnames(Xlag) <- paste0("lag", 0:max(lags))

dat <- data.frame(
  y = rpois(n, exp(0.3 + 0.4 * Xlag[, "lag1"] - 0.2 * Xlag[, "lag2"])),
  t = seq_len(n),
  x = Xlag[, "lag0"],
  group_dummy = 1L
)
lag_x <- function(t, lag) Xlag[t, paste0("lag", lag)]

mesh <- fm_mesh_1d(
  seq(min(Xlag), max(Xlag), length.out = 12),
  degree = 2,
  boundary = "free"
)

spde <- inla.spde2.pcmatern(
  mesh,
  prior.range = c(1, 0.01),
  prior.sigma = c(1, 0.01)
)

A_lag <- Reduce(
  `+`,
  lapply(lags, \(lag) {
    inla.spde.make.A(
      mesh = mesh,
      loc = matrix(lag_x(dat$t, lag), ncol = 1),
      group = rep(lag, n),
      n.group = length(lags)
    )
  })
)

# Plain INLA with global stack A matrix.
idx <- inla.spde.make.index(
  name = "LagEffect",
  n.spde = spde$n.spde,
  n.group = length(lags)
)

stk <- inla.stack(
  data = list(y = dat$y),
  A = list(1, A_lag),
  effects = list(
    data.frame(Intercept = rep(1, n)),
    idx
  )
)

fit_stack <- inla(
  y ~ 0 + Intercept +
    f(
      LagEffect,
      model = spde,
      group = LagEffect.group,
      control.group = list(model = "ar1")
    ),
  family = "poisson",
  data = inla.stack.data(stk),
  control.predictor = list(
    A = inla.stack.A(stk),
    compute = TRUE
  ),
  control.fixed = list(mean = 0, prec = 0.01),
  control.compute = list(config = TRUE),
  verbose = F
)

# Plain INLA with local A matrix on the f() term.
fit_alocal <- inla(
  y ~ 0 + Intercept +
    f(
      LagEffect,
      w0,
      model = spde,
      group = LagEffect.group,
      ngroup = length(lags),
      control.group = list(model = "ar1"),
      A.local = A_lag,
      values = seq_len(spde$n.spde)
    ),
  family = "poisson",
  data = list(
    y = dat$y,
    Intercept = rep(1, n),
    LagEffect = rep(seq_len(spde$n.spde), length.out = n),
    LagEffect.group = rep(lags, length.out = n),
    w0 = rep(0, n),
    A_lag = A_lag
  ),
  control.fixed = list(mean = 0, prec = 0.01),
  control.compute = list(config = TRUE),
  verbose = F
)

fit_stack <- inla.rerun(fit_stack)
fit_alocal <- inla.rerun(fit_alocal)